Adding Grafana Cloud Website Monitoring via Terraform
Table of Contents
Introduction
Let me start be saying if you want to try Grafana, please use my referral code which will enable me to unlock more features to write about and share!
Following on from my static website hosting posts, I wanted to add some uptime monitoring so I could keep an eye on things and potentially differentiate between hosting platforms.
Initially I chose Uptime Robot , but their free tier is so basic and easy to setup in the portal it doesn’t warrant a blog post, which could be a good thing, but doesn’t make for good content!
I then looked at Grafana , which is a multi-platform open source analytics and interactive visualization web application. Providing charts, graphs, and alerts for the web when connected to supported data sources. This peaked my interest as it has a vendor supported Terraform Provider so I attempted to set the whole thing up in code with a view to deploy with Github Actions.
I’ll be focusing on Grafana cloud, you can use Grafana Cloud to avoid installing, maintaining, and scaling your own instance of Grafana. A free account includes free forever access to 10k metrics, 50GB logs, 50GB traces, & more, so may be sufficient for by humble blog site!
First of all I registered for a Grafana account, I used their quickstart guide
Then I started to build in code, the first thing to appreciate is Grafana is hierarchical, which I didn’t at first, so I added my API key in the wrong place!
Grafana Hierarchy
I couldn’t find a decent overview on the website, but from what I understand, it looks like this:
Some notable points, the trial is limited to 1 cloud stack and Grafana Synthetic Monitoring is installed by default, but not initialised. API Keys can be granted at all levels in the diagram so make sure you are in the right dialogue.
Disclaimers an Limitations
Within the scope of my use case, this code project did not pan out as I would like, I was unable to build idempotent code that I could run in one go, nor could I initialise the Synthetic Monitoring plug-in via code.
In all honesty you may as well just run in the synthetic_monitoring_check’s, rather than re-build the cloud stack in code (start from step 5 / code block 3), unless you are going to use more of the functionality, so I’ll leave all my code here for completeness.
Terraform Code
Creating a New Cloud Stack
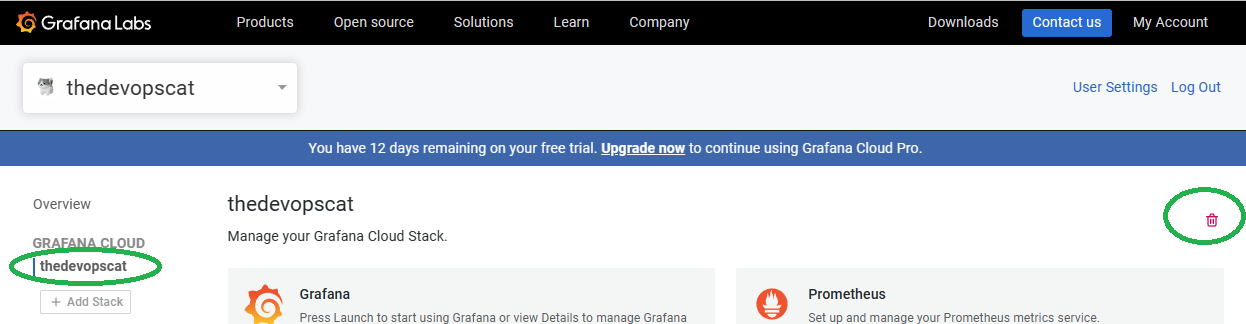
If you are running on the trial, you will need to delete your initial default cloud-stack from the portal if you already created one.
- First you’ll need an API key for Terraform to use, open your org level api keys e.g. https://grafana.com/orgs/thedevopscat/api-keys and create ‘OrgAdmin’ with the Admin role, I pass this value in the grafana_main_org_admin_api_key variable.
- Run in stage 1 code block, you should now have a named cloud stack and a new cloud-stack level admin API key.
##################################
# Code Block 1: Create the stack #
##################################
provider "grafana" {
  alias         = "cloud"
  cloud_api_key = var.grafana_main_org_admin_api_key
}

resource "grafana_cloud_stack" "doc_stack" {
  provider    = grafana.cloud
  name        = "thedevopscat.grafana.net" # Conventionally matches the url of the instance
  slug        = "thedevopscat"             # Subdomain that the Grafana instance will be available
  region_slug = "prod-eu-west-3"
  #description = "Test Grafana Cloud Stack"
}

resource "grafana_api_key" "doc_stack_admin" {
  provider         = grafana.cloud
  cloud_stack_slug = grafana_cloud_stack.doc_stack.slug
  name             = "StackAdmin"
  role             = "Admin"
}
- Now you can run code block 2, note the new additional provider alias arguments are fed from the first stage. This stage is optional, this is really just setting up and proving the provider for any future code additions.
###############################################
# Code Block 2: Create resources in the stack #
###############################################

provider "grafana" {
  alias         = "doc_stack"
  url           = grafana_cloud_stack.doc_stack.url
  auth          = grafana_api_key.doc_stack_admin.key
  cloud_api_key = var.grafana_main_org_admin_api_key
}

# Just to test the api and provider config
resource "grafana_folder" "cat_folder" {
  provider = grafana.doc_stack
  title    = "Cat Folder"
}
Enabling Synthetic Monitoring
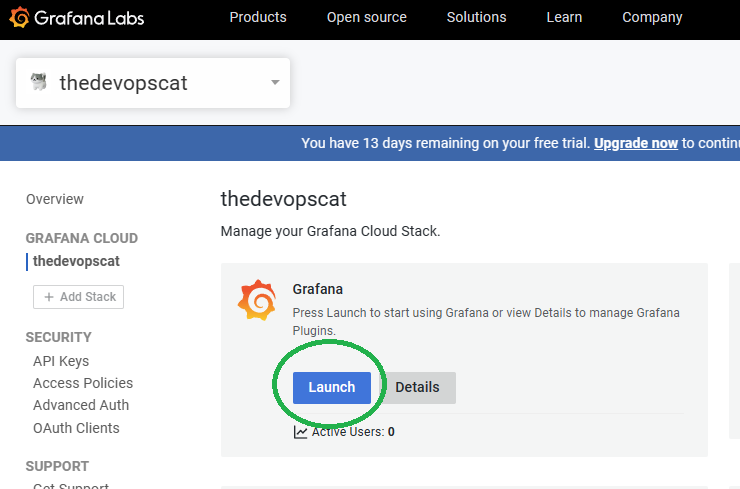
- Now the unsatisfying manual part 😞, from the portal click on your new stack, and launch Grafana
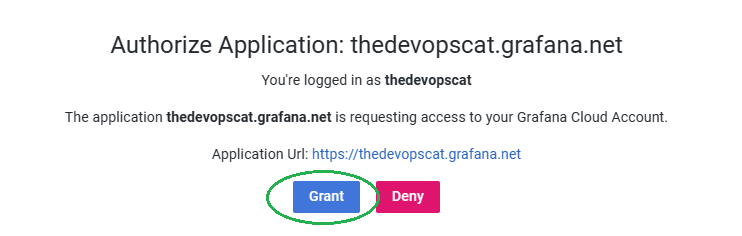
- If this is a fresh code-built stack, grant the application access, you should close the session and re-auth to make sure everything is happy.
- You now need to initialise the Synthetic Monitoring plug-in in the portal e.g. https://thedevopscat.grafana.net/a/grafana-synthetic-monitoring-app/home , then generate another access token from https://thedevopscat.grafana.net/a/grafana-synthetic-monitoring-app/config then copy out the value to populate variable grafana_cloud_synthetic_monitoring_token
Note: I tried this in code, grafana_synthetic_monitoring_installation installed for me, but wasn’t usable via web or code, so is wasted effort, so I have omitted this code step.
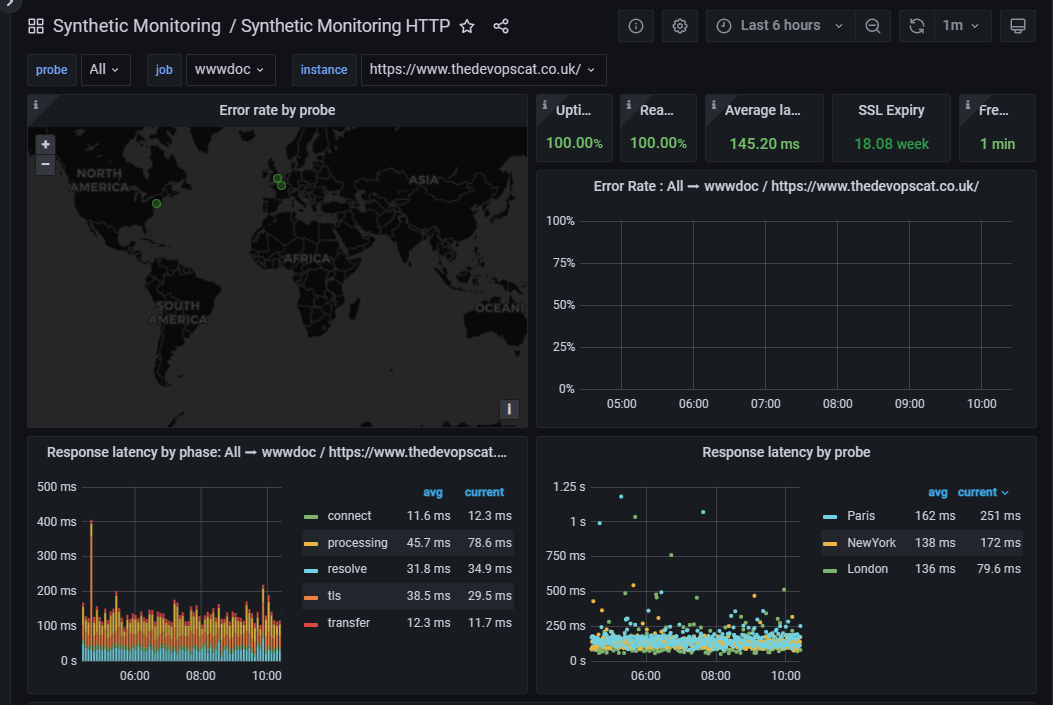
- Now you can run code block 4 and setup your monitoring, you can easily duplicate the grafana_synthetic_monitoring_check resource block, give a unique name and update the URL if you have multiple sites.
####################################################
# Code Block 4: Interact with Synthetic Monitoring #
####################################################

provider "grafana" {
  alias           = "sm"
  sm_access_token = var.grafana_cloud_synthetic_monitoring_token  # grafana_synthetic_monitoring_installation.sm_stack.sm_access_token did not work for me
  sm_url          = "https://synthetic-monitoring-api-eu-west-3.grafana.net"
}

data "grafana_synthetic_monitoring_probes" "main" {
  provider = grafana.sm
}

resource "grafana_synthetic_monitoring_check" "www_doc" {
  provider = grafana.sm
  job      = "wwwdoc"
  target   = "https://www.thedevopscat.co.uk/"
  enabled  = true
  probes = [
    # all_probes = data.grafana_synthetic_monitoring_probes.main.probes.*
    data.grafana_synthetic_monitoring_probes.main.probes.London,
    data.grafana_synthetic_monitoring_probes.main.probes.Paris,
    data.grafana_synthetic_monitoring_probes.main.probes.NewYork
  ]

  settings {
    http {
      ip_version = "Any"
      method     = "GET"
    }
  }
}
...
Conclusions
Don’t judge me, this is not how I usually write Terraform! Building this from scratch is very chicken-and-egg, each code block is entirely dependent on the next, as this extends to the multiple provider blocks and Terraform initialises these before an apply this can’t be a single stage apply.
Furthermore, synthetic monitoring can’t be fully enabled in code, this seems to be a limitation of the current provider (v1.35) at the time of writing.
All that said, I like the end result, just not the imperfect code base!
If you want to try Grafana, please use my referral code https://grafana.com/auth/sign-up?refCode=gr8iBawxULrMBPn which will enable me to unlock more features to write about and share!